Sunday, October 30, 2016

MICRONERVA - my "moon shot"

I finally updated my research group web page, admittedly more than halfway though a busy semester!   On my web page you can meet the new students in my research group, along with new articles and podcast appearances, and a description of our new masters degree emphasis in astronomyNow it is time for a new blog post too!

This past summer MICRONERVA started to take up residence at Baker Observatory.  In this post I will highlight the work of Central Methodist University senior physics major Denise Weigand, and how we went from a drawing on a Powerpoint slide to the built frame for the MICRONERVA prototype enclosure.

Denise was funded as a Missouri SpaceGrant Consortium intern to come work with me at Missouri State University.  I spent most of my summer traveling on the east coast (two immediate family weddings, a couple conferences, etc.), so we had to work remotely.  For that, we used Google+ Hangouts to share screens, audio and video to communicate effectively from a distance.

First, a bit about MINERVA, the "parent" observatory concept behind MICRONERVA.  For a number of years I've been helping with the more complex, larger version called MINERVA.  It's designed to be completely robotic and autonomous after initial setup and regular maintenance:


The basic principle behind MINERVA is to synthesize a larger telescope aperture by combining the light from multiple, smaller telescopes at a lower cost.  The cost of a telescope has a steeper than linear dependence on the telescope primary mirror area:


The cost of single aperture telescopes (red and blue data points) compared to multiple aperture telescopes (green data points).  The solid lines in red and blue indicate approximate power law relationships.  The jump at a diameter of ~1.2 meters marks the transition from the amateur market to the lower demand market that is partially dictated by military expenditures.  From Figure 1 of Swift et al. 2015.

For seeing-limited telescopes there is no loss in angular resolution, which is true at visible wavelengths for any primary mirror larger than ~8-inches in diameter without adaptive optics.  Additionally, the spectrograph shrinks in volume as N3/2, where N is the number of telescopes, making it a lot cheaper and more stable too. In the case of MINERVA, four 0.7 m telescopes need a spectrograph 1/8th the volume of a spectrograph for a single 1.4 m telescope.  Thus, one saves costs on both the telescopes and the spectrograph.  And because the spectrograph is smaller, it makes it easier to measure precise radial velocities to hunt for exoplanets.  It's a win-win situation all around.  As far as I know, MINERVA is the first successful on-sky demonstration of this multi-telescope approach for precise spectroscopy.  One of the enabling technologies are fiber optics, which allow us to bring together the light from several telescopes to a single spectrograph entrance slit.

Anyway, back to MICRONERVA.

Upon my arrival at Missouri State University in the fall of 2014, I saw that we had a number of computer controlled CPC800 Celestron Telescopes lying around for educational use.  I also noted that with a simple tip-tilt adaptive optics, light could be effectively coupled from these eight-inch telescopes into special optical fibers called single mode fibers.  In other words, we could build a mini-version of MINERVA - aka MICRONERVA - if we could effectively turn these telescopes into computer controlled autonomous robots.  Additionally single mode fibers provide the ultimate limit in the stable illumination of spectrographs, critical for measuring precise radial velocities.

We decided to start with a prototype of array of four telescopes, but this concept is extremely scalable and even cheaper than MINERVA.  I envision a future array of many hundreds of these telescopes, similar to the HATPI concept by Gaspar Bakos for exoplanet transit searches, but this time for spectroscopy.  I find this is a potentially more cost effective approach for large aperture spectroscopy compared to other concepts such as the Mauna Kea Spectroscopic Explorer:

HATPI concept design

Fast forward to the spring of 2016.  My former student Claire Geneser, now a graduate student at Mississippi State University, managed to get the telescopes to point to a series of targets entirely under the control of a laptop computer:


We still had a number of issues to solve - could we guide at <1 arc-second precision?  Could we control all of these telescope autonomously from a web page?  I'll post about our progress on these challenges at a later date.  We also needed an enclosure to hold the telescopes, something that could open and close on its own.  That is the problem Denise chose to solve.

Denise joined my research group in mid-June of 2016. We had looked into buying a pre-built "dome" like the excellent domes from Astrohaven.  However, at costs of >$25,000, these were beyond the limits of our modest budget.  We were going to have to build one ourselves. Our prototype telescope array will be located at Baker Observatory, shown below:

Baker Observatory, north of Marshfield, MO, the birthplace of Edwin Hubble

In the photo above you can see two traditional telescope domes that are the usual landmark for an observatory.  However, these domes are far more complex than necessary to build an autonomous robotic facility.  Between the lower shutter, dome slit, and dome rotation, three separate motors are needed to open, close and point the dome.  A far simpler approach for autonomy is to design an enclosure that needs only one motor to open and close.  One motor is much easier to program and control than three, even if the end result isn't as exciting as looking at the domes above.

Below is the first sketch Denise and I made of what would eventually be our prototype enclosure in mid-June. This drawing was made with Powerpoint while we talked on Google+ hangouts more than 1000 miles apart:

The first MICRONERVA enclosure sketch.
The design involved the smallest number of exterior surfaces - five - and a single motor to make the design as simple as possible (one of the guiding principles in our design process).  It wasn't our first design, but it was the first design to make sense.  The four shapes inside the triangular room represent the envelops of the four telescopes - e.g., the space they will fill after going through all possible directions they point.  The red surfaces for the roof, the triangles the side walls, and the rectangles some legs to hold the structure off the ground, to prevent moisture wicking and contact with snow in the winter.   The whole thing would be oriented east-west, to enable the largest declination range viewable, at the expense of some east-west horizon obscuration by the triangular walls.

Denise set about her summer turning this sketch into reality.  First up was getting the dimensions right, and here were some sketches that passed back and forth between us.  We started with Powerpoint because it had an easier learning curve than AutoCAD, and let us quickly iterate on ideas.


At the end of June, it was time to graduate to three dimensions, which we used Google Sketchup to get started:


We also started thinking about how the roof would roll of and on.  We had already settled on this excellent motor drive from MVO Controls:


Denise made a parts list, and readied to go to Lowe's and Home depot to acquire the wood we needed.  We decided to start with wood rather than aluminum or metal, since it was more forgiving of us to make mistakes, and it was cheaper too.  We'd learn our mistakes on this prototype, which would make things easier the second time around if we went for more permanent and expensive materials.

We next enlisted the help of our campus mechanical engineer, Brian Grindstaff, to help with some of the engineering logistics - e.g. building the floor like a deck with joists and slatted cross-beams and such.  For the first three weeks in the July heat, Denise and Brian build the decking floor and roof frame in the loading dock outside our departments building.  Having it on campus made it easier to work on every day, but then we'd have to transport it out to Baker Observatory, a 40 minute drive!


Brian helped Denise put her design into AutoCAD, and pick the roofing material, wheels, wheel channel. and many other practical aspects of our design under Denise's guidance.

By August 8th, Denise and I used Google maps to plot a final location for the enclosure at Baker Observatory, next to my colleague Dr Mike Reed's robotic 16-inch telescopes, BORAT.  It was ready to ship! The night prior Denise and I went to Baker Observatory with wooden stakes, string and a level, and staked out the position of the enclosure and made sure it'd be on ground that was level enough to be fixed with a shovel and some sweat.


To get the enclosure to Baker Observatory, we made the enclosure relatively easy to disassemble into three pieces - the roof, the deck floor, and the extension for the rails when the roof is "open".  We transported it on one of my students 16'x8' trailers.

The morning of August 9th, we loaded the enclosure onto the trailer.  We left as early as possible to beat the Southwest Missouri summer heat and humidity.  I also recruited my entire research team to help with the lifting and moving.  We had gotten good at this teamwork, because back in June we built a fence at the observatory.  We used reclaimed wood from a long fence in my subdivision that had been torn down and replaced after a pickup truck crashed through it:

Missouri State physics majors Joe Huber and Ryan Hall

Fence building at Baker Observatory in June of 2016 to help with car headlights during our public viewing nights.  Featuring Missouri State CS majors Frank Giddens and America Nishimoto, physics major Laura Ketzer, and Dr. Mike Reed.

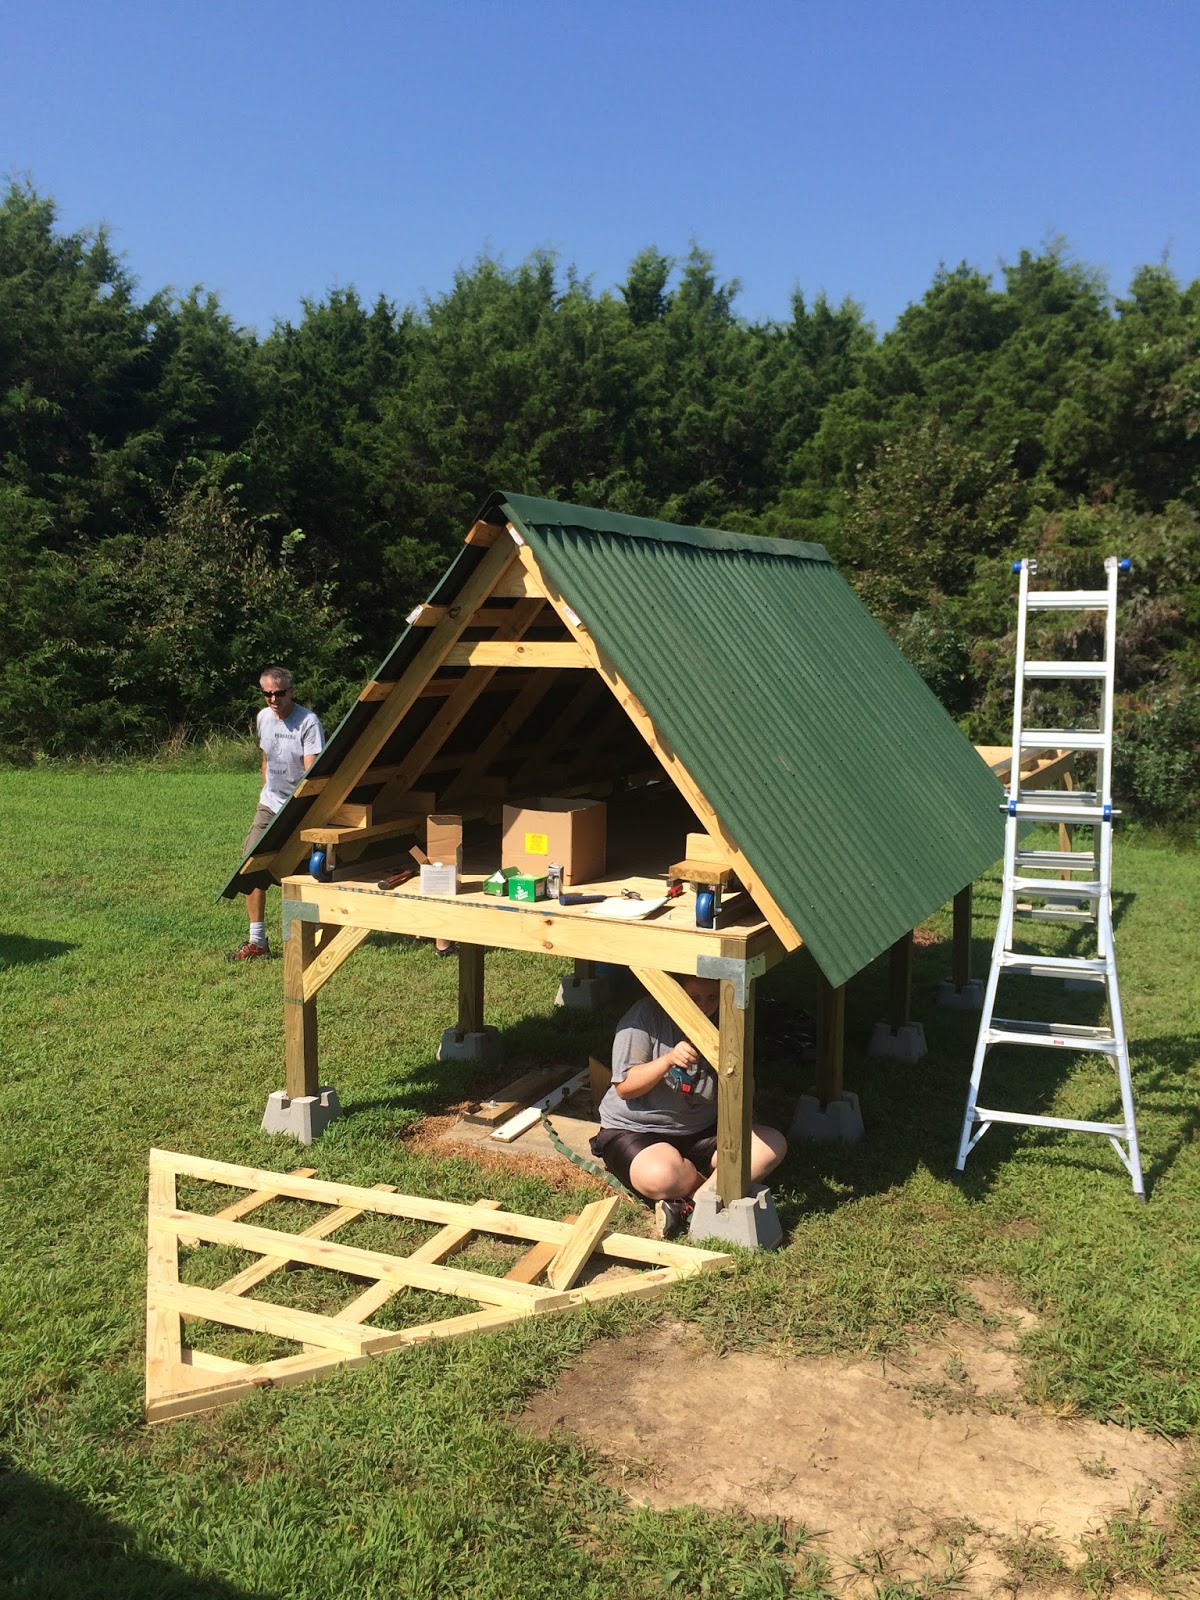
Unloading the enclosure pieces on August 9th took a lot of work, and we were all very dehydrated by midday:


Lifting the roof onto the platform was the hardest part.

Denise Weigand next to her roll-off roof enclosure design built and installed!  August 9th, 2016

Two days later we came back and added cross-beam support to the legs, and the roof panels:


We'd add the walls by the end of that week in August.  Denise returned to Central Methodist University for her senior year. Today, the enclosure is buttoned up, complete with tornado tie-downs to keep it from getting blown over:


It's not quite ready for the MICRONERVA telescopes yet. We're waiting on funding to add some interior environment control. The motor has been tested and rolls the roof on and off.  I'll update on the other aspects of MICRONERVA in a future blog post.

Saturday, June 25, 2016

Guest blog post - Weighted Trend Filtering Algorithm and Machine-Learning Template Selection for Time-Series Analysis

This months exoplanet research blog post comes from a former undergraduate and current colleague of mine, Giri Gopalan.  Giri and I have known each other since 2009 when he was a Summer Undergraduate Research Fellow at Caltech.  I had already identified a student to work with me that summer, but then Giri showed up at my door.  He was so convincing in his confidence, so exuberant in his interest, and so knowledgeable with applied mathematics.  I had to take him on as a second summer student, and I'm glad I did.  The Kepler telescope hadn't launched yet, and discovering transiting exoplanets with ground-based surveys were de rigueur.  The result of our summer working together, which we revisited to finish last year, was recently published in the Publications of the Astronomical Society of the Pacific.  Giri took a successful algorithm for filtering ground-based time-series data, and improved upon it with mixed results. Giri is on his way to a three year PhD program at the University of Iceland in the fall of 2016.

###

Photometric time series data have provided a fruitful resource for astronomers in recent times; the curation and analysis of photometric time series have allowed for the detection of transients, perhaps most notably exoplanets. A planet which revolves around a star with respect to our line of sight results in a characteristic dip or transit  in the star’s light curve and by detecting such dips, astronomers gain evidence for the existence of an exoplanet.

Unfortunately photometric time series are subject to noise of two major varieties: white and systematic noise. White noise is of the standard independent and identical structure from measurement to measurement, whereas systematics correlate heavily between different stars and time scales (e.g., instrumental measurement errors or seeing conditions that vary on a nightly basis). Such noise complicates the process of detecting transients,  (e.g. the characteristic depressions or transits from exoplanets), and so it is prudent to decontaminate light curves of this noise before analyzing them to look for transients. It turns out that in practice, systematics tend to dominate noise patterns in comparison to white noise. Our work concerns the implementation and application of a well known systematic trend filtering methodology by Bakos and Kovacs, the Trend Filtering Algorithm (TFA), and the investigation into ways to improve its performance.   

The methodology (in the non-reconstructive mode used for our analysis) essentially consists of two major components: the creation of “template light curves” which are meant to encapsulate typical systematic noise patterns and the filtering of systematic noise from a particular light curve given this set of templates. TFA assumes that systematic noise is a linear combination of these “basis” vectors and the residual of the projection of a light curve onto this “basis” is the filtered signal. Hence we wrote MATLAB code to perform this least squares projection in addition to weighted least squares (where the weights are the inverse of measurement uncertainties of the light curve to be filtered as noted in the thesis of A.Pal) leveraging matrix algebra. An illustration below demonstrates the idea:


For the template selection procedure we implemented and tested a version of hierarchical clustering, introduced by Kim et al. in 2009.

Our overall results were mixed; the analysis on real data (select PTF and 2MASS data) seemed to indicate that overfiltering occurs if a template set is not chosen carefully. On the other hand simulation studies indicate that the modifications we investigated did not improve exoplanet detection, but potentially variable detection (“potentially” because the variable detection numbers were very small for all combinations of factors tried in our simulation study).

Nonetheless, it was an extremely gratifying experience to tie up work begun during the summer of 2009 as a Caltech summer undergraduate research fellow. Peter’s guidance and willingness to see this work through was pivotal and has set an example of mentorship that I hope to fulfill [Editor's note: Thanks Giri!]. Moreover, I am very grateful for the feedback I received from the remainder of my collaborators. Looking forward I still think there is much that can be done with this work: the first being the translation of the code into other languages (e.g., R or Python) and a systematic noise removal methodology which leverages a fully probabilistic (e.g., Bayesian hierarchical) model.

Sunday, May 29, 2016

The Goldilocks Trap: Guest post from Andrew Vanderburg, PhD student at Harvard

This guest post is from Harvard astronomy graduate student Andrew Vanderburg.  Andrew is better known for his extensive work on the NASA K2 mission, including the discovery of a disintegrating minor planet orbiting a white dwarf!   Andrew and I collaborated on a paper that is published in the Monthly Notices of the Royal Astronomical Society, and is available in pre-print form here: http://arxiv.org/abs/1604.03143.  I remember when I had the genesis of the idea for this paper -  I was at the American Astronomical Society meeting in Washington DC in January of 2014; I excitedly rushed around the meeting to other exoplanet scientists bouncing the idea off of them.  Several of them would end up being co-authors on our paper.  No one had thought of this angle before. However, soon thereafter an excellent series of observational papers would come out from Paul Robertson demonstrating that we were on to something.  Read on for more from Andrew!


A major goal for astronomers studying exoplanets is to learn how common is it to find small, rocky planets orbiting in their stars’ habitable zones -- that is, orbiting just far enough away from their host star for the planet to have liquid surface water (and possibly alien life). One of the most promising ways to address this question is by closely monitoring the star’s radial velocity, or the speed at which stars are traveling towards or away from us here on Earth. We can detect the presence of planets around these stars because they tug on their host stars very slightly as they orbit. For the past 20 years, radial velocity measurements have been one of the most successful methods for discovering exoplanets.


Radial velocity measurements of the first exoplanet discovered around a sun-like star. The planet tugging on the star as it orbits causes a wobble in the radial velocity.

As our technology has improved and we learned to measure radial velocities (or RVs for short) more and more precisely, the situation has become a bit more complicated. It turns out that other processes on stars can cause apparent changes in its radial velocity, which can either mask (or more disturbingly) mimic the signatures of small exoplanets. One of the main culprits are starspots, which are the same as sunspots on our own Sun. When starspots rotate in and out of view as the star spins, they can cause RV variations which look a lot like the wobble of exoplanets that orbit their stars every time the star rotates.

Recently, there have been several high-profile cases where starspots have likely fooled astronomers into believing a planet orbited a star (see for example http://www.space.com/26432-potentially-habitable-exoplanets-gliese-581-existence.html). For astronomers trying to find small planets orbiting in their host stars’ habitable zones, this is a scary lesson! For one thing, two planets which we thought might be at the right temperature for liquid surface water to exist actually never existed. And for another, how will we ever be able to confidently say that a particular signal is a planet instead of starspots?

For these reasons, Peter and I decided to investigate the phenomenon of stellar activity (like starspots) mimicking and masking habitable exoplanets. We wanted to figure out under what circumstances could this type of planetary deception take place and how we might avoid it when searching for habitable exoplanets in the future.

We performed an analysis using a mixture of theoretical stellar models, observational data from NASA’s Kepler space telescope, and empirically determined relations describing the rotation of stars. First, we figured out the periods at which starspots can mimic exoplanets. We thought that these periods should be related the period of the star’s rotation (because spots will rotate in and out of view every time the star rotates), and our analysis confirmed that intuition. We were a bit surprised, however, to see how important the “harmonics” of the star’s rotation period are for stellar activity. It turns out that starspots can mimic planets orbiting at one half the star’s rotation period, or one third the star’s rotation period, just as easily as at the rotation period itself. We also found that even if there is a real planet orbiting near the star’s rotation period, it’s considerably more difficult than usual to detect it with radial velocity measurements.

Once we knew the importance of the star’s rotation period (and its harmonics), we used gyrochronology relations to predict the rotation periods for stars of different masses and ages. As stars age, they start to spin more and more slowly, and gyrochronology is the study of how that deceleration happens. Generally, more massive stars spin faster than lower mass stars. So cool, low-mass M-dwarfs have longer rotation periods, which means that any spurious planet detections would happen at similarly long periods.

Finally, we compared the periods where we expect spurious planet detections from our analysis to orbital periods of exoplanets in the habitable zone. The habitable zone also depends on the mass of the star -- for stars like the sun, the habitable zone is at periods around 1 year (like the Earth). But for smaller stars, the orbital periods of habitable zone exoplanets are shorter because these stars are intrinsically fainter, and to stay warm enough for liquid water to form, you need to be closer to the star.

It turns out that stars about half the mass of the sun have rotation periods close enough to the orbital period of habitable zone exoplanets, and therefore, we expect to see stellar rotation mimicking habitable-zone exoplanets around this type of star. This is the exact type of star where starspots have previously been found to mimic habitable zone exoplanets, and we could see more of the same until better ways have been found to separate out the signatures of starspots and genuine exoplanets. Until then, our take-away message is that if you’re looking for habitable-zone exoplanets around stars about half the size of the sun, buyer beware! You risk being fooled by stellar activity.

The time-scales of stellar activity from starspots that confuse radial velocity measurements.  For M dwarfs, habitable zone exoplanets have orbital periods (green stripe) that are in the same range as rotation periods (grey region).  We've nicknamed this overlap the "Goldilocks trap."  Similarly, the amplitudes of the apparent and real radial velocity changes are in the same ranges too.

Friday, May 13, 2016

Undergraduate Student Research Highlights

I'd like to take a time to acknowledge all the hard work my undergraduate students put into their research projects this semester.

Claire Geneser is graduating (today!) and lead my research group project on MICRONERVA.  She is on her way to earn her PhD at Mississippi State University in the fall.  Here she is giving a poster presentation at our college Undergraduate Research Day on April 21st:


Claire also decided to photobomb Ryan Hall standing with his poster at the Undergraduate Research Day.  Ryan is finishing his junior year and will be applying to graduate schools in the fall.  He taking over the MICRONERVA project from Claire.


Claire and Ryan would go on to give back-to-back talks the next day(!) at the NASA SpaceGrant Missouri meeting in Rolla, MO:

Two additional students joined my research group this year, and they also presented their posters at both the Undergrad Research Day and the Missouri SpaceGrant meeting.  Frank Giddens is a CS major working on an altitude-azimuth sensor made from an arduino board:


Joe Huber is working with me on separating subgiants and giants using photometry only for improving the TESS mission target selection:


Finally, I wanted to highlight two students working with Dr. Reed in our department, on Transit Timing Variations of Kepler planets (Shannon Dulz) and the asteroseismology of sub-dwarf B stars (Laura Ketzer), seen in the photos below.  Both Shannon and Laura will be seniors in the fall:


Tuesday, April 26, 2016

Guest post from University of Arizona postdoctoral scholar Dr. Huan Meng

Today's post comes from my collaborator and current University of Arizona postdoctoral scholar Dr Huan Meng.  Our work is featured in a NASA/JPL press release today that is getting coverage in the news.   

I (Peter Plavchan) planned and proposed these observations back in 2009 with the Spitzer Space Telescope.  The Spitzer Space Telescope team accepted our proposal, and made the observations in April 2010 simultaneously with a coordinated ground-based effort with four large telescopes in the Northern and Southern Hemispheres.   I remember the observing runs vividly, because I was using a telescope at Kitt Peak in Arizona along with Dr. Kevin Covey, and after collecting some data we were beset by a "major" snow fall atop the mountain:


The ground-based effort was monumental - one telescope in South America was a queue based telescope, but the other two were used by a colleague in Mexico, and colleagues who had traveled to a second telescope in South America just to get this data.  We were fortunate that on one night when one telescope went down we had another telescope covering the gap in data, and we all communicated online between the various telescopes to check in and see how things were going.

The project generated so much data for the Spitzer Space Telescope that it filled up the storage space onboard the spacecraft.  The Spitzer Space Telescope scheduling team, for which I am forever grateful, had to space out the campaigns every-other-night instead of every night.  On the days inbetween our observations, the Deep Space Network had to communicate with the Spitzer Space Telescope and download our data to make room for the next night of observations.

In 2013, Huan Meng joined me from the University of Arizona for a six month visiting graduate student fellowship at the NASA Exoplanet Science Institute where we finished analyzing the data.  After a pause to work on other projects, in 2015 Huan wrote it up and submitted it for publication.  While the publication of our paper this year ended one 7 year long journey in science, it opened a whole new method for studying the inner accretion environments of young stars!

Read on for Huan's story:

Most, if not all, young stars are born with disks of gas (mostly hydrogen and helium) and dust (small solid smoke-like particles mostly made of silicates and carbon). In astronomy, this disk is called a "proto-planetary disk" because at later stages of evolution, material in the disk will aggregate, accrete, and give rise to a planetary system like the Solar System.

However, the architecture of our own Solar System may not be representative of all planetary systems. The more we learned about exoplanetary systems, the more diverse we found they are. For example, a well-known population of planets that is absent in the Solar Sytems is "hot Jupiters." The Solar System has two gas giant planets, Jupiter and Saturn, both fairly far from the Sun. Jupiter's orbit is 5.2 Astronomical Units in radius (1 AU is the average distance between the Sun and the Earth), and Saturn's is 9.5 AU. By contrast, Jupiter's hot cousins in many exoplanetary systems are merely a fraction of an AU from their central stars and are very hot in temperature. Did these "hot Jupiters" form in-situ close to the stars? Or did they form further out and migrate inward ever since?  And did that happen during or after the protoplanetary disk existed?  Because the structure and evolution of the protoplanetary disk sets the initial conditions for planet formation, a crucial piece of evidence in this debate is whether there is planet-building material so close to the star.

It is long known from theories and spectroscopic observations that a protoplanetary disk cannot reach the photosphere, or "surface," of its star — The disk always has a hole in the center. Two major mechanisms can make the hole. On the one hand, gas in the inner region of protoplanetary disk is ionized and interacts with the stellar magnetosphere. If getting too close, it will be diverted off the disk plane along the magnetic field lines and accreted onto the star near the stellar magnetic poles. This is also how young stars accrete mass. An important reference for this so-called "magnetospheric truncation" of a disk is the co-rotation radius, at which the orbital period of circumstellar material matches the rotation period of the star. For mass accretion onto the star to proceed, the disk inner edge has to stay interior to the co-rotation radius and the magnetospheric truncation distance also has to be smaller. On the other hand, if solid dust particles are placed inside of a distance from the star at which their temperatures would surpass the sublimation limit of the material, the solid particles will get too hot and will be vaporized. This mechanism can also truncate the disk at the "sublimation radius," which is typically outside of the co-rotation radius. These different disk truncation radii provide a diagnostic: by measuring where protoplanetary disks get truncated and comparing with the theoretical expectations, we may tell which mechanism is at work in which disk.


So, we should just measure the sizes of the inner disk holes, right?  Unfortunately, this is not as simple as laying a ruler on top of a photograph. The sizes of the inner disk holes are expected to be small. For a solar-mass young star (called a "T Tauri" star) in the nearest star-forming regions, the expected disk truncation radii are hundreds of millions of times smaller than their distances to us. They are too small to be directly resolved with the current astronomical technology. Over the past decade, the only technique that can systematically explore the inner regions of protoplanetary disks is near-infrared interferometry, for which an array of designated telescopes observes the same object, combining signals to reconstruct a partial image of the object with higher spatial resolution. To obtain a measurement from the interferometric data, people have to introduce some assumptions about the disk geometry that are not necessarily justified. Such interferometric measurements have suggested that some protoplanetary disks around the most massive young stars, called "Herbig Be" stars, are truncated by magnetospheric accretion; disks around intermediate-mass "Herbig Ae" stars can be well described by a directly heated, "puffed-up" inner rim truncated at distances that corresponds to temperatures between 1500 and 2000 Kelvin (2200 to 3100 degree Fahrenheit), a typical range of silicate dust grain sublimation temperatures. However, the trend does not extrapolate down to the regime of solar-mass T Tauri stars, many of which appear to have larger-than-expected inner disk cavities. Oversized inner disk holes around T Tauri stars have raised questions about the roles of unrecognized physical processes in addition to the two major mechanisms considered above.  And there are also possible problems with the model assumptions upon which the interferometric measurements are made.


Our work is a different and novel approach to this issue. Since T Tauri stars are known to be variable stars, we can simultaneously monitor the changing stellar emission at a shorter wavelength and the disk response at a longer wavelength in the infrared. Given the constant and limited speed of light, it takes time for the variable stellar emission to travel to the disk and trigger a response, just like "light echoes." Therefore, the long-wavelength disk light curve (echoes) should lag behind the short-wavelength stellar counterpart (direct light) by the amount of the additional light-travel time1. If such a time lag is detected, we can compute the corresponding light-travel distance between the central star and its inner disk rim. Compared with interferometry, such measurements are relatively independent of model assumptions and should be more robust.

The basic idea of the method, called "reverberation mapping", has been used in extragalactic astronomy for over 20 years to measure the distance between supermassive blackholes in active galactic nuclei and their surrounding moleculuar clouds ("broad line regions"). To carry out the experiment for the first time around stars, we pre-selected a field in the rho Ophiuchi cloud complex, one of the nearest star-forming regions to the Solar System, and coordinated four ground-based telescopes to observe the area simultaneously with NASA's Spitzer Space Telescope on three nights. The ground-based telescopes, in Arizona, Chile, and Mexico, were used to monitor the stars in the near-infrared H and K wavebands (1.6 and 2.2 micron), while Spitzer worked at 4.5 micron wavelength to keep an eye on the disks. To validate any time comparison, we had to first correct the light-travel time on our receiving end, especially between the Spitzer Space Telescope and the Earth. As a result, 27 young stars were observed in the common field of view.  One of the T Tauri stars, called YLW 16B, was found to vary significantly in brightness rapidly and  have a time lag. This is the first detection of light echoes on the stellar scale!

Detailed analysis of the data revealed that the variable signals of YLW 16B in H and K bands were synchronized all the time, consistent with both being from the accreting gas right above the stellar photosphere. The signals at 4.5 micron lagged behind both H and K by 74.5 +/- 3.2 seconds. Interestingly, YLW 16B is a known edge-on system because of its mid-infrared molecular spectrum. Taking into account the viewing geometry, our reverberation measurement of the radius of its inner disk hole was 0.084 +/- 0.004 AU. Considering the simplifications we had used to convert the time lag to a single radius, we estimated that the total error is likely larger than the nominal one by a factor of several, on the order of 0.01 AU.


We can place our measurement in the context of previous interferometric results.  See our data point in red in the figure above compared to previous work. The reverberation inner radius of YLW 16B, a solar-mass T Tauri star, is consistent with a "puffed-up" inner disk rim, in the presence of backwarming, truncated at 1500 Kelvin, a typical dust sublimation temperature. This is in line with the interferometric disk sizes measured around intermediate-mass Herbig Ae stars. But unlike the old interferometric measurements of most other T Tauri stars, YLW 16B does not have an oversized inner disk hole and does not require any additional mechanism. For the planet formation question asked earlier in the article, now we have settled one more piece of the puzzle.

---
Footnote 1. It may take time for the disk to respond to changing starlight. Reflection is instantaneous once allowing for light-travel time; thermal response time of isolated and exposed dust particles should be well under a second given their tiny thermal capacities, much faster than the time resolution we can achieve in real observations; radiative transfer becomes important in the bulk disk and should take days to take effect, but it has no influence on the short timescale of our interest. Hence, the disk response time can be safely neglected for our purpose.

Wednesday, April 13, 2016

Guest Post from NASA Sagan Postdoctoral Fellow Dr. Jonathan Gagné

Today's post comes from my collaborator and current NASA Sagan Postdoctoral Fellow, Dr Jonathan Gagné.  Our work is featured in a press release from this week.   

In other news, another one of my collaborators, Andrew Vanderberg, had his paper accepted for publication.  Andrew, a graduate student at Harvard, analyzed the relevance of M dwarf stellar rotation periods in the search of exoplanets with the radial velocity method.  More on this new paper in another post...


When exoplanets orbit their host star, they exert a gravitational force on it, causing the star to revolve around a tiny ellipse that is usually smaller than the star itself. Astronomers can then detect this tiny stellar motion and deduce the presence of a planet indirectly, through what is called the radial velocity method. This is the method that allowed scientists to discover the first exoplanets, called Hot Jupiters, around other stars in our Galaxy.


It is however very difficult to detect small planets with the radial velocity method, as they have a much weaker pull on their host star.  One way to do this is to search around smaller stars, which are more easily affected by their planets. These small stars, also called low-mass stars, are also much more numerous in our Galaxy, which makes them even more interesting as targets for planet hunters.


Astronomers have thus tried identifying small planets around small stars with the radial velocity method, but have stumbled upon a major obstacle: stellar activity. Much like the Sun, other stars have magnetic fields that evolve through time and cause dark stellar spots to appear and move around on their surface. These dark spots, combined with the rotation of the star, can imitate the signature of a planet in our data, an effect that is called "stellar jitter". The signature of these stellar spots is strong at the visible wavelengths of light, which have been used in the radial velocity method.

The team of Dr. Plavchan have started exploring another avenue that might crack this obstacle of stellar activity: infrared light. Effectively, the effect of dark stellar spots is expected to be much weaker at the longer wavelengths of light, in a domain that is called the near-infrared. The signature of a true exoplanet, however, would cause exactly the same signature at all wavelengths of light. Obtaining data in the near-infrared could thus be used to differentiate true exoplanets from stellar activity.

Measuring the small motions of stars in the near-infrared is a technical challenge, since this requires very precise and well calibrated instruments. Dr. Plavchan has worked with the NASA Jet Propulsion Laboratory (JPL) to develop a piece of equipment, called an isotopic methane gas cell, that is used to achieve a much better precision in our radial velocity measurements at near-infrared wavelengths.

The methane gas cell developed by Dr. Plavchan and NASA/JPL.
Using this updated equipment, our team has started a follow-up of 27 bright low-mass stars, some of which are known to have exoplanets, and others of which are known to have very strong stellar activity. The CSHELL spectrograph at the NASA IRTF 3-meter telescope was used to carry out this survey; our gas cell survey was added to improve this instrument's radial velocity capabilities. The IRTF medium-sized telescope was ideal to obtain more observing time, which was needed to demonstrate the efficiency of this new equipment.

This was the start of a 5-years survey of tireless data accumulation and fight against systematics of the CSHELL instrument. The CSHELL camera uses a detector that is 25 years old and started to slowly deteriorate with age. We had to develop very specialized data analysis tools in order to successfully extract our data despite these newly appearing problems.

Our team has also developed a new method to extract the data in an efficient way, while taking account of the specialized equipment that we added to CSHELL. This method is described in a scientific paper that was led by Peter Gao.

The NASA/IRTF telescope located on the summit of Mauna Kea in Hawaii.

The results of the survey itself were presented in another scientific paper that I led. We demonstrate in this paper that the gas cell has much improved the ability of CSHELL to detect smaller exoplanets around low-mass stars. Our gas cell allowed obtaining radial velocity measurements that were more precise than all other surveys which were undertaken with CSHELL!

Our survey has also allowed us to detect the known exoplanet system called GJ 876 bc, which had only been previously detected at visible wavelengths. A few other stars showed unexpected variations that could be due to exoplanets, but an additional follow-up will be needed to confirm their existence.

Another important feature of our survey is  that we measured the level of stellar jitter on some very young and active low-mass stars. Our results indicate that this jitter seems smaller than what is typically seen at visible wavelengths on some of the most active stars in our solar neighborhood. Our data provides a few bricks to the wall of understanding stellar jitter, as other near-infrared and visible-light surveys will need to observe the same stars before we can really understand jitter in a more precise way.


The radial velocity variations of the star GJ 876 which were measured in our survey. The expected disruption of the star’s velocity from its known planets is displayed with the black curve.

In summary, the work that we presented in this new scientific paper demonstrates the high potential of using near-infrared light to detect small exoplanets around small stars, and in particular to beat the obstacle of stellar activity. The same method and equipment will be used on new instruments such as iSHELL at the IRTF telescope, which will potentially allow the detection of Super-Earths, rocky planets that are much larger and more massive than the Earth, near the habitable zone of their host star where water can exist in its liquid form.

This is only the beginning of the quest for small planets using near-infrared light and the radial velocity method, and the methods and equipment that the team of Dr. Plavchan have developed will be extremely useful to answer fundamental questions that will direct the future of exoplanet research.

Monday, March 21, 2016

The day we took over astro-ph!

Today I am happy to announce that four of my former students have all posted their science papers to astro-ph* on the same day.   Along with posting one of my conference proceedings, we have "taken over" astro-ph for the day!

* What is astro-ph?  It's part of arxiv.org, a server where scientists post pre-prints of their papers.  It's the main place where all astronomers go to see the latest research.  We discuss them over coffee five mornings a week, we get emails five nights a week with the latest additions.  Oftentimes, papers appear here before a Journal has reviewed the paper.

All four papers are accepted for publication in the following scientific journals - The Astrophysical Journal, The Monthly Notices of the Royal Astronomical Society, and the Publications of the Astronomy Society of the Pacific.

Now my esteemed colleagues, my former students will guest author posts here over the coming weeks about their papers.

Here are brief descriptions and links to the papers:

  • Dr. Jonathan Gagne, a former NASA Exoplanet Science Institute Visiting Graduate Student Fellow, and now a NASA Sagan Postdoctoral Fellow at Carnegie DTM in Washington DC, published a survey of 36 nearby and/or young M dwarfs looking for evidence of exoplanet candidates.  In this paper, Dr. Gagne made use of a novel technique for the Doppler Effect at near-infrared wavelengths with the NASA Infrared Telescope Facility and CSHELL spectrograph.  Read on for what we found!
  • Peter Gao, a current Caltech Planetary Sciences graduate student, and soon to be NASA Postdoctoral Program Fellow at NASA Ames, published a novel data analysis for near-infrared echelle spectra for the purposes of high-precision radial velocity measurements.  Peter successfully implemented what has been referred to as the "grand solution" in deriving the underlying stellar spectra from the data.  This is particularly helpful in the presence of absorption lines (tellurics) from the Earth's atmosphere.  Read on for what we found!
  • Dr. Huan Meng, a former NASA Exoplanet Science Institute Visiting Graduate Student Fellow, and now a postdoctoral scholar at the University of Arizona, published the first detection of a light echo from the inner circumstellar disk around a young, accreting proto-star.  Dr. Meng took the wildly successful technique for measuring the distances to clouds of gas surrounding supermassive black holes at the centers of many galaxies, called reverberation mapping, and scaled it down to observe young stars in Rho Ophiuchus with the use of the Spitzer Space Telescope and four ground-based observatories.  Read on for what we found!
  • Giri Gopalan, a former Caltech Summer Undergraduate Research Fellow, published a paper describing a new version of the successful Trend Filtering Algorithm (TFA), used to detect transiting exoplanets from ground-based telescope surveys.  In his paper, he restates the TFA  equations in a matrix formulation, which allows for the introduction of including measurement uncertainties, and also introduces a common machine learning technique - hierarchical clustering - for the optimization of selecting the trends used.  Read on for what we found!
  • Finally, I published a conference proceedings from the International Astronomical Union Symposium, held in Atlanta, GA in May 2015.  This short two page report summarizes the Near-Infrared Radial Velocity Survey (Project NIRRVS) of which Jonathan and Peter are leaders of our collaboration.  Read on here!

PS, at least one more paper is coming!

Tuesday, March 1, 2016

Recruiting the next Generation of Astronomers

One year ago the astronomy community was rocked by the national news of protests surrounding the construction of the Thirty Meter Telescope atop Mauna Kea in Hawaii:

http://www.huffingtonpost.com/2015/04/13/hawaii-telescope-protests-tmt-mauna-kea_n_7044164.html

Relations were further strained when two UC Berkeley Astronomy professors made unfortunate choices of language in emails about the protests.  Whatever their intent, the impact of these emails mattered.  Members of our astronomy community and Hawaiians saw these emails as racist to varying extents, particularly in the context of the history of the US assimilation of Hawaii:

https://storify.com/docfreeride/team-science-apologizes-badly-widens-rift-with-mau

http://mahalonottrash.blogspot.com/2015/05/decolonizing-astronomy-or-why-debt.html

Wherever your opinions may lie, these events and others over the past year have led to conversations about race, sexual harassment, and the potential for change in our community.  Importantly, those receptive to new, diverse viewpoints have had an opportunity to hear them.

In particular, I joined a new Facebook group promoting equity and inclusion in professional astronomy. This group is a "next level safe zone" where minorities and women can express their viewpoints, and have them echoed and supported by like-minded individuals.  My role in this group is not to tell others what I think is best; it's simply to listen and learn.  And it's changed me in the process too.

One of the leading voices of this new community is Professor John Johnson at Harvard University.  He posts regularly to his blog at: http://mahalonottrash.blogspot.com/ . I've known John Johnson for a number of years, particularly while we overlapped at Caltech.  We first met when we shared a dinner as graduate students at Lick Observatory.  Since then, I've been fortunate to collaborate with him on the MINERVA Observatory among several other papers and projects.  John Johnson is quantifiably the most prolific observational exoplanet scientist to earn their astronomy PhD in the past 15 years. 

This past July, I found myself sitting down to dinner once again with John Johnson.  We were both attending the Extreme Precise Radial Velocity Conference held at Yale.  He's a busy guy, and we don't get to interact as often now that we've both left Caltech.  I asked John - what can I personally do to improve the diversity of our field?  How do I foster such an environment?  John Johnson's answer was obvious in hindsight. It was a forehead slapping moment for me:

Recruiting.

If premier athletic departments can devote full-time personnel to recruiting the best athletes worldwide, why couldn't I borrow some of their techniques and switch from passive to active recruiting?  What gets a top-level high school athlete to commit to a particular University?  It's the personal connection that recruiters form with them number one, and number two, the promise of being in a successful environment.

John Johnson suggested I go recruit from predominantly minority area high schools in the St Louis area.  John himself grew up in a suburb of St Louis, and went to college in nearby Rolla, Missouri before becoming an academic rock star as a graduate student at UC Berkeley.   He recommended that I establish personal relationships with the physics teachers and their students, and to encourage the students to come to Missouri State University to conduct exoplanet research with me.  Fostering an inclusive and equitable environment once they matriculate is the other half of the equation.

So, that's what I've done and I will continue to do.  I contacted a few high school principals in the St Louis suburbs, including in Ferguson, one of the birthplaces of #blacklivesmatter.  One forwarded my information on to their physics teacher.  We corresponded for a few weeks, and he agreed to let me come and talk to the physics students at two of the high schools he teaches at.

One early morning this fall, I hopped into my car and drove the three hours to St Louis.  I visited two physics classes at two different high schools.  It was a real learning experience for me, the physics teacher, and the students.  I opened the students' eyes to potential careers in science that they hadn't known about before.  I gave each of them my business card and asked them to stay in touch if they decided to apply to Missouri State University.  I offered them research opportunities in my group if they matriculated.  The physics teacher has invited me back for next year.  Personally, as I drove home later that afternoon, I found the experience to be incredibly rewarding.  I was #ohdi - Out Here, Doing It.  Time will tell, but I hope to have an impact on the future diversity of our field for the better.

Visiting a high school physics class room in the St Louis area to recruit the next generation of Astronomers.
A few months later in December 2015, the protests at the University of Missouri (a two hour drive away in Columbia) would echo on my campus at Missouri State University.  A group of students submitted a list of demands to our University President.  Our University administration fortunately listened immediately, and it's a work in progress.

During one lecture in my general education astronomy class, I expressed support and encouragement to those students on my campus.  After all, college is a place for students to find their voice, and education doesn't always come in the form of a classroom.  After class, several students came up to me and thanked me for what I had said.  Unbeknownst to me, one minority student was a freshman thinking about majoring in Physics and Astronomy.  He was in the classroom at the back, listening. He hadn't spoken to me the entire semester.  And on that day he came up to the front of the large lecture hall, shook my hand, and joined my research group.


Sunday, February 14, 2016

Accessing the Kepler Mission data

I've been asked several times over the years:
 
Would you be able to give advice on how to download a NASA Kepler light curve and run a quick analysis on it?

Usually the query is on behalf of an ambitious and motivated student from a high school or middle school.  I've put together a set of brief instructions to let you (and others) get started.

Introduction
 
The NASA Kepler mission was launched in the early morning hours of March 7th, 2009, with the goal of assessing how common Earth-sized planets are around other stars.  The results have been phenomenal, with several thousand candidate exoplanets found by the mission and ~1000 confirmed/validated, many of those in multiple planet systems.

How does Kepler work? Briefly, it stared at a part of the sky 10 degrees x 10 degrees square in the constellations of Cygnus and Lyra for four straight years, pausing only to relay data back to Earth or for temporary spacecraft malfunctions (safe modes).  It has since entered a new "zombie" life as K2, but I won't get into the details of its new mission.

Every 30 minutes (or 1 minute in some cases), Kepler collected a measurement of the brightness of ~150,000 carefully selected stars in that field of view.  We call the brightness measurements as a function of time a "light curve" and/or photometric time-series.  Kepler exploits the transit method for finding exoplanets, which occurs when the planet orbiting another star "transits" in front of (eclipses) that star as seen from our vantage point here in the Solar System.

The transit method for finding exoplanets


Since the stars are bigger than planets (except in some extreme cases!), the planet does not block all of the stars light, but a characteristic percentage that is related to the square of the ratio of the size of the planet to the size of the star.  For an Earth-sized exoplanet transiting in front of a Sun-like star, the exoplanet would cause the star to dim while the planet was transiting by 0.01%, or 100 parts per million.  Jupiter sized exoplanets, ~10x bigger than the Earth, produces an easier to detect dimming of ~1%.   The transit duration (how long it lasts) and how often transits repeat are also important, but let's just stick with the dimming amount, or transit "depth" for now.

Sounds easy right?  No.  Oftentimes there is "activity" going on the surface of the star, including flares and starspots.  These can also produce irregular and semi-periodic changes in the brightness of the star, like this example, Kepler Object of Interest (KOI) 254:

Kepler light curve for KOI-254.  The wavy pattern at the top is because of starspots on the surface of the star.  Even a flare around Day 70 looks like it is visible (the horizontal axis is time in days; the vertical axis is brightness).  The Jupiter-like planet that transits in front of this star causes the short dimming events you see below a normalized intensity of 0.94.

And all this has to be done for very shallow dimming events for the smallest planets.  The noisiness of the digital cameras and within individual pixels within those digital cameras starts to matter too.

There are a number of online tools that you can use to access Kepler data, and I've organized them roughly in order of level of difficulty in terms of learning curve.

1) Planet Hunters

For the act of transit searching, there is a citizen-science project called Planet Hunters that is quite successful and found and published some planets that the official Kepler Mission team missed!

http://www.planethunters.org/

It's a great way to get acquainted with the Kepler data with an easy-to-use interface.  Many amateur astronomers have gotten involved and contributed to our body of knowledge coming from the Kepler mission.

2) MAST

Another great tool for visualizing Kepler light curves, is maintained at MAST, the Mulkulski Archive for Space Telescopes:


You search for your target here. It helps to have the name of your target - either Kepler Object of Interest # for candidate planet host stars, Kepler # for confirmed planet host stars, or Kepler Input Catalog (KIC) # for any one of the host stars Kepler monitored, or the coordinates (Right Ascension and Declination).  More on getting those down below.

The website will return any matching results in a table.  Please bear in mind that these websites are coded by small teams of engineers and scientists who don't have the resources of thousands of web programmers that places like Google and Facebook have to make their complicated (and slick) search interfaces.


Then, clicking on one of these links will take you to a page that lets you plot the light curve in your web browser:


In the above example you can easily see the dips in brightness from the transiting planet, and you can use your mouse to zoom in to see a single transit event:


There it is, raw Kepler data!  You can even hover over the plot and see the values of the data being plotted.    What I like to do with my students is have them manually measure the transit depth of a Jupiter-sized planet (since easy to see) and compute the radius of the planet from the square root of the transit depth.  You can work this up in a simple spreadsheet like this one:


3) NASA Exoplanet Archive

The NASA Exoplanet Archive lets you find, visualize and compute periodograms (find significant repeating patterns) for all Kepler light curves here:

http://exoplanetarchive.ipac.caltech.edu/

http://exoplanetarchive.ipac.caltech.edu/applications/ETSS/Kepler_index.html


All you would need would be the KIC ID of the target, or you can search by Right Ascension and Declination.  Fortunately, the NASA Exoplanet Archive also maintains lists of Confirmed and candidate Kepler exoplanets, which gives you more naming information (KIC#, KOI#, Kepler #), coordinates, and model stellar sizes, to name a few important properties:

http://exoplanetarchive.ipac.caltech.edu/cgi-bin/TblView/nph-tblView?app=ExoTbls&config=cumulative


For example, on the Kepler light curve search page, you can enter in the Kepler ID (KIC #):

8561063, and Click "View"

This is the KIC # for the multi-planet system Kepler-42, also known as KOI-961.  Kepler-42 is one of my favorite Kepler systems, discovered by some of my colleagues.  It's got three planets that transit, between the size of Earth and Mars, and they orbit a dim red dwarf star!
 

In the results table, if you click on the link:
(PDCSAP Time Series)

for any entry, it will take you to the light curve visualization tool with all the Kepler time-series for that star (Kepler data is split into "quarters" typically of ~90 day length).
This particular source has a LOT of Kepler short cadence data, so it takes a long time to load the interface.  But eventually you will be rewarded with seeing the actual Kepler data that was used to discover this fascinating multi-planet system around a cool red dwarf star.

I was responsible for the scientific input for a lot of these tools when I used to work at the NASA Exoplanet Archive.  So maybe I'm a bit biased!

From there, you can refer to the User Guides to learn more about everything that can be done to manipulate the data within the browser, including computing some advance time-series analysis tools called "periodograms".  If you want to do more, you can download the light curves too and play with them offline with your own favorite software like Microsoft Excel.

4) PyKE
Another far more complex tool to download is called Pyke: 

I wouldn't recommend it for beginners, and it helps to already be familiar with the Python programming language and/or IRAF astronomer tools.  But PyKE allows you to interact with the Kepler light curves (and individual detector pixels) at a very low-level.